Difference between revisions of "Graphs of the Sine and Cosine Functions"
Jump to navigation
Jump to search
| Line 3: | Line 3: | ||
The sine and cosine functions have several distinct characteristics: | The sine and cosine functions have several distinct characteristics: | ||
| − | * They are periodic functions | + | * They are periodic functions. |
* The domain of each function is <math> (-\infty, \infty) </math> and the range is [−1,1]. | * The domain of each function is <math> (-\infty, \infty) </math> and the range is [−1,1]. | ||
* The graph of <math> y = \sin{x} </math> is symmetric about the origin. | * The graph of <math> y = \sin{x} </math> is symmetric about the origin. | ||
* The graph of <math> y = \cos{x} </math> is symmetric about the y-axis. | * The graph of <math> y = \cos{x} </math> is symmetric about the y-axis. | ||
| + | * The period of | ||
| + | * Given <math> y = A\sin{(\omega x)} </math> or <math> y = A\cos{(\omega x)} </math> for some real numbers <math> A </math> and <math>\omega</math>: | ||
| + | :* The '''amplitude''' of the function is <math> |A| </math>, and represents the maximum distance from the x-axis that the function covers. | ||
| + | :* The '''period''' (the distance between two peaks or two valleys) is <math> \frac{2\pi}{\omega} </math>, and represents one full "cycle" of the function. | ||
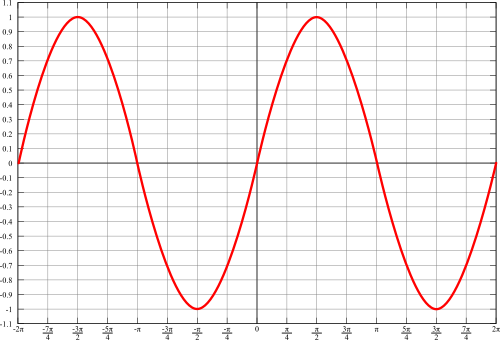
The graph of the sine function looks like this: | The graph of the sine function looks like this: | ||
Revision as of 15:40, 5 October 2021
The sine and cosine functions have several distinct characteristics:
- They are periodic functions.
- The domain of each function is and the range is [−1,1].
- The graph of is symmetric about the origin.
- The graph of is symmetric about the y-axis.
- The period of
- Given or for some real numbers and :
- The amplitude of the function is , and represents the maximum distance from the x-axis that the function covers.
- The period (the distance between two peaks or two valleys) is , and represents one full "cycle" of the function.
The graph of the sine function looks like this:
Careful analysis of this graph will show that the graph corresponds to the unit circle. x is essentially the degree measure (in radians), while y is the value of the sine function.
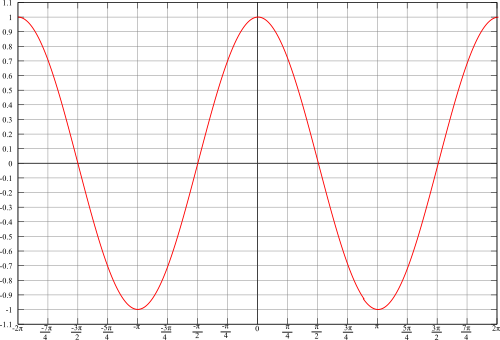
The graph of the cosine function looks like this:
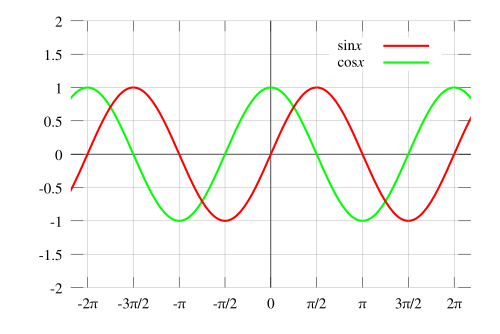
As with the sine function, analysis of the cosine function will show that the graph corresponds to the unit circle. One of the most important differences between the sine and cosine functions is that sine is an odd function (i.e. while cosine is an even function (i.e. .
Sine and cosine are periodic functions; that is, the above is repeated for preceding and following intervals with length .
Resources
- Graphs of the Sine and Cosine. Written notes created by Professor Esparza, UTSA.
- Graphs of the Sine and Cosine Functions, Lumen Learning


