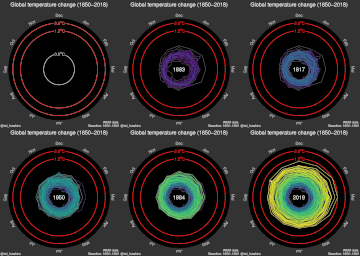
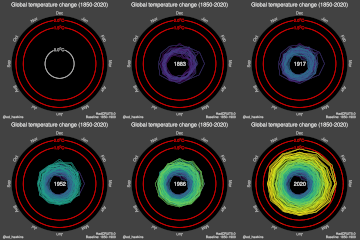
File:5 9 16 Andrea TempSpiralEdHawkins.gif
From Department of Mathematics at UTSA
Jump to navigation
Jump to search

Size of this preview: 563 × 599 pixels. Other resolutions: 225 × 240 pixels | 451 × 480 pixels | 743 × 791 pixels.
Original file (743 × 791 pixels, file size: 1.79 MB, MIME type: image/gif, looped, 170 frames, 29 s)
Note: Due to technical limitations, thumbnails of high resolution GIF images such as this one will not be animated.
This file is from Wikimedia Commons and may be used by other projects. The description on its file description page there is shown below.
Summary
| Description5 9 16 Andrea TempSpiralEdHawkins.gif |
English: Climate spiral: A spiral graph represents global temperature change (1850 to 2018); Data from the HadCRUT4 dataset http://www.metoffice.gov.uk/hadobs/hadcrut4/ |
|||||||||||||||||
| Date | ||||||||||||||||||
| Source | Spiralling global temperatures. climate-lab-book.ac.uk. Retrieved on 2025-11-15. | |||||||||||||||||
| Author |
creator QS:P170,Q50946243 |
|||||||||||||||||
| Other versions |
|
|||||||||||||||||
Source code
A static version of this can be created with the following code:
| Python Matplotlib source code |
|---|
#!/usr/bin/python3
# -*- coding: utf8 -*-

import calendar
import matplotlib as mpl
import matplotlib.pyplot as plt
import numpy as np
import os
from math import *

plt.rc('mathtext', default='regular')

data_filename = "HadCRUT.4.6.0.0.monthly_ns_avg.txt"

if not os.path.isfile(data_filename):
    print("need raw data from https://www.metoffice.gov.uk/hadobs/hadcrut4/index.html")
    exit()

year_month_T = []
with open(data_filename, "r") as df:
    for l in df.readlines():
        l = l.strip().split()
        year_month_T.append([int(l[0].split("/")[0]), int(l[0].split("/")[1]), float(l[1])])

years, months, T = [np.array(i) for i in zip(*year_month_T)]
T_baseline = np.mean(T[np.logical_and(years >= 1850, years <= 1900)])
T -= T_baseline
angles = -(months-1) / 12. * 2 * pi
points = np.vstack((angles, T)).T
n = len(points)

fig = plt.figure(figsize=(5, 5.4))
fig.patch.set_facecolor('#333333')
cmap = plt.cm.get_cmap('viridis')
ax = fig.add_axes([0.07, 0.07, 0.86, 0.8], projection="polar", axisbg="k")
ax.set_theta_zero_location("N")
r0, r1 = -1., 2.3
ax.set_ylim(r0, r1)

ax.add_artist(mpl.patches.Arc((0, 0), 2*(0-r0), 2*(0-r0), transform=ax.transData._b,
    theta1=90+20, theta2=90-20, color="white", lw=1.8))
ax.add_artist(mpl.patches.Arc((0, 0), 2*(1.5-r0), 2*(1.5-r0), transform=ax.transData._b,
    theta1=90+10, theta2=90-10, color="red", lw=1.8))
ax.add_artist(mpl.patches.Arc((0, 0), 2*(2-r0), 2*(2-r0), transform=ax.transData._b,
    theta1=90+8, theta2=90-8, color="red", lw=1.8))
ax.text(0, 0.0, r"$0^\circ C$", color="white",
    ha='center', va="center", fontsize=10, zorder=-1)
ax.text(0, 1.5, r"$1.5^\circ C$", color="red",
    ha='center', va="center", fontsize=10, zorder=-1)
ax.text(0, 2.0, r"$2.0^\circ C$", color="red",
    ha='center', va="center", fontsize=10, zorder=-1)

# note: replotting each time is slow, could be faster if figure was kept.
for i, (start, stop) in enumerate(zip(points[:iframe], points[1:iframe+1])):
    x, y = zip(start, stop)
    ax.plot(x, y, color=cmap(i /n))

ax.get_yaxis().set_visible(False)
ax.set_xticks(np.radians(np.arange(0, -360, -30)))
ax.set_xticklabels([calendar.month_abbr[i+1] for i in range(12)], color="#cccccc")
for i, tick in enumerate(ax.get_xticklabels()):
    tick.set_rotation(-30 * i)
ax.grid(False)

fig.suptitle(u"Global temperature change (%s\u2013%s)" % (min(years), max(years)),
    color="white")
fig.text(0.96, 0.02, 'HadCRUT4', ha='right', va='bottom', color="white", fontsize=8)
#ax.text(0, r0, str(years[iframe]), color="white", ha='center', va="center", fontsize=12)

plt.savefig("Temperature_spiral_HadCRUT4.svg",
    facecolor=fig.get_facecolor(), edgecolor="none")
|
Licensing
This file is licensed under the Creative Commons Attribution 3.0 Unported license.
Attribution:
Ed Hawkins
- You are free:
- to share – to copy, distribute and transmit the work
- to remix – to adapt the work
- Under the following conditions:
- attribution – You must give appropriate credit, provide a link to the license, and indicate if changes were made. You may do so in any reasonable manner, but not in any way that suggests the licensor endorses you or your use.
Captions
Add a one-line explanation of what this file represents
Items portrayed in this file
depicts
9 May 2016
image/gif
1f567bfe1a2f37676b0dfc69c713505ca343b231
1,880,557 byte
28.8 second
791 pixel
743 pixel
File history
Click on a date/time to view the file as it appeared at that time.
| Date/Time | Thumbnail | Dimensions | User | Comment | |
|---|---|---|---|---|---|
| current | 15:30, 1 March 2020 |  | 743 × 791 (1.79 MB) | Bürgerentscheid | original file now resized with lanczos3. |
File usage
The following page uses this file:


