File:Extremum Testing.svg
Jump to navigation
Jump to search


Size of this PNG preview of this SVG file: 650 × 325 pixels. Other resolutions: 320 × 160 pixels | 640 × 320 pixels | 800 × 400 pixels | 1,024 × 512 pixels | 1,280 × 640 pixels.
Original file (SVG file, nominally 650 × 325 pixels, file size: 75 KB)
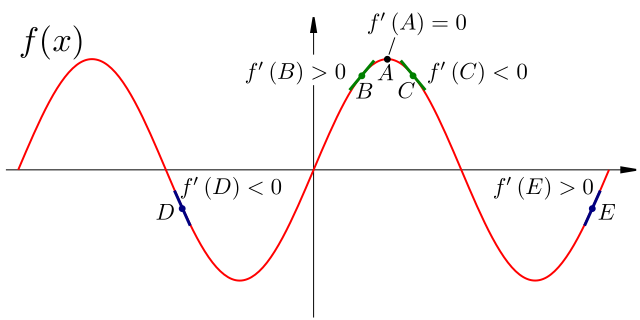
| Description | A diagram showing how to classify an extremum according to gradients of nearby points. The green points and gradients show good points to sample. The blue points nad graidents show bad points to sample, as they were taken on the far side of other extrema and give the wrong answer. | ||
| Date | |||
| Source |
self-made This W3C-unspecified vector image was created with Inkscape . |
||
| Author | Inductiveload | ||
| Permission (Reusing this file) |
|
File history
Click on a date/time to view the file as it appeared at that time.
| Date/Time | Thumbnail | Dimensions | User | Comment | |
|---|---|---|---|---|---|
| current | 14:45, 23 October 2007 | | 650 × 325 (75 KB) | Inductiveload | added gradient lables for all points |
File usage
The following 2 pages use this file: