Problem Solving Introduction
Contents
Formal logical systems
At its core, mathematical logic deals with mathematical concepts expressed using formal logical systems. These systems, though they differ in many details, share the common property of considering only expressions in a fixed formal language. The systems of propositional logic and first-order logic are the most widely studied today, because of their applicability to foundations of mathematics and because of their desirable proof-theoretic properties. Stronger classical logics such as second-order logic or infinitary logic are also studied, along with Non-classical logics such as intuitionistic logic.
First-order logic
First-order logic is a particular formal system of logic. Its syntax involves only finite expressions as well-formed formulas, while its semantics are characterized by the limitation of all quantifiers to a fixed domain of discourse.
Early results from formal logic established limitations of first-order logic. The Löwenheim–Skolem theorem (1919) showed that if a set of sentences in a countable first-order language has an infinite model then it has at least one model of each infinite cardinality. This shows that it is impossible for a set of first-order axioms to characterize the natural numbers, the real numbers, or any other infinite structure up to isomorphism. As the goal of early foundational studies was to produce axiomatic theories for all parts of mathematics, this limitation was particularly stark.
Gödel's completeness theorem established the equivalence between semantic and syntactic definitions of logical consequence in first-order logic. It shows that if a particular sentence is true in every model that satisfies a particular set of axioms, then there must be a finite deduction of the sentence from the axioms. The compactness theorem first appeared as a lemma in Gödel's proof of the completeness theorem, and it took many years before logicians grasped its significance and began to apply it routinely. It says that a set of sentences has a model if and only if every finite subset has a model, or in other words that an inconsistent set of formulas must have a finite inconsistent subset. The completeness and compactness theorems allow for sophisticated analysis of logical consequence in first-order logic and the development of model theory, and they are a key reason for the prominence of first-order logic in mathematics.
Gödel's incompleteness theorems establish additional limits on first-order axiomatizations. The first incompleteness theorem states that for any consistent, effectively given (defined below) logical system that is capable of interpreting arithmetic, there exists a statement that is true (in the sense that it holds for the natural numbers) but not provable within that logical system (and which indeed may fail in some non-standard models of arithmetic which may be consistent with the logical system). For example, in every logical system capable of expressing the Peano axioms, the Gödel sentence holds for the natural numbers but cannot be proved.
Here a logical system is said to be effectively given if it is possible to decide, given any formula in the language of the system, whether the formula is an axiom, and one which can express the Peano axioms is called "sufficiently strong." When applied to first-order logic, the first incompleteness theorem implies that any sufficiently strong, consistent, effective first-order theory has models that are not elementarily equivalent, a stronger limitation than the one established by the Löwenheim–Skolem theorem. The second incompleteness theorem states that no sufficiently strong, consistent, effective axiom system for arithmetic can prove its own consistency, which has been interpreted to show that Hilbert's program cannot be reached.
Other classical logics
Many logics besides first-order logic are studied. These include infinitary logics, which allow for formulas to provide an infinite amount of information, and higher-order logics, which include a portion of set theory directly in their semantics.
The most well studied infinitary logic is . In this logic, quantifiers may only be nested to finite depths, as in first-order logic, but formulas may have finite or countably infinite conjunctions and disjunctions within them. Thus, for example, it is possible to say that an object is a whole number using a formula of such as


Higher-order logics allow for quantification not only of elements of the domain of discourse, but subsets of the domain of discourse, sets of such subsets, and other objects of higher type. The semantics are defined so that, rather than having a separate domain for each higher-type quantifier to range over, the quantifiers instead range over all objects of the appropriate type. The logics studied before the development of first-order logic, for example Frege's logic, had similar set-theoretic aspects. Although higher-order logics are more expressive, allowing complete axiomatizations of structures such as the natural numbers, they do not satisfy analogues of the completeness and compactness theorems from first-order logic, and are thus less amenable to proof-theoretic analysis.
Another type of logics are fixed-point logics that allow inductive definitions, like one writes for primitive recursive functions.
One can formally define an extension of first-order logic — a notion which encompasses all logics in this section because they behave like first-order logic in certain fundamental ways, but does not encompass all logics in general, e.g. it does not encompass intuitionistic, modal or fuzzy logic.
Lindström's theorem implies that the only extension of first-order logic satisfying both the compactness theorem and the downward Löwenheim–Skolem theorem is first-order logic.
Nonclassical and modal logic
Modal logics include additional modal operators, such as an operator which states that a particular formula is not only true, but necessarily true. Although modal logic is not often used to axiomatize mathematics, it has been used to study the properties of first-order provability and set-theoretic forcing.
Intuitionistic logic was developed by Heyting to study Brouwer's program of intuitionism, in which Brouwer himself avoided formalization. Intuitionistic logic specifically does not include the law of the excluded middle, which states that each sentence is either true or its negation is true. Kleene's work with the proof theory of intuitionistic logic showed that constructive information can be recovered from intuitionistic proofs. For example, any provably total function in intuitionistic arithmetic is computable; this is not true in classical theories of arithmetic such as Peano arithmetic.
Algebraic logic
Algebraic logic uses the methods of abstract algebra to study the semantics of formal logics. A fundamental example is the use of Boolean algebras to represent truth values in classical propositional logic, and the use of Heyting algebras to represent truth values in intuitionistic propositional logic. Stronger logics, such as first-order logic and higher-order logic, are studied using more complicated algebraic structures such as cylindric algebras.
Problem-solving strategies
Problem-solving strategies are the steps that one would use to find the problems that are in the way to getting to one's own goal. Some refer to this as the "problem-solving cycle".
In this cycle one will acknowledge, recognize the problem, define the problem, develop a strategy to fix the problem, organize the knowledge of the problem cycle, figure out the resources at the user's disposal, monitor one's progress, and evaluate the solution for accuracy. The reason it is called a cycle is that once one is completed with a problem another will usually pop up.
Insight is the sudden solution to a long-vexing problem, a sudden recognition of a new idea, or a sudden understanding of a complex situation, an Aha! moment. Solutions found through insight are often more accurate than those found through step-by-step analysis. To solve more problems at a faster rate, insight is necessary for selecting productive moves at different stages of the problem-solving cycle. This problem-solving strategy pertains specifically to problems referred to as insight problem. Unlike Newell and Simon's formal definition of move problems, there has not been a generally agreed upon definition of an insight problem (Ash, Jee, and Wiley, 2012; Chronicle, MacGregor, and Ormerod, 2004; Chu and MacGregor, 2011).
Blanchard-Fields looks at problem solving from one of two facets. The first looking at those problems that only have one solution (like mathematical problems, or fact-based questions) which are grounded in psychometric intelligence. The other is socioemotional in nature and have answers that change constantly (like what's your favorite color or what you should get someone for Christmas).
The following techniques are usually called problem-solving strategies
- Abstraction: solving the problem in a model of the system before applying it to the real system
- Analogy: using a solution that solves an analogous problem
- Brainstorming: (especially among groups of people) suggesting a large number of solutions or ideas and combining and developing them until an optimum solution is found
- Critical thinking
- Divide and conquer: breaking down a large, complex problem into smaller, solvable problems
- Hypothesis testing: assuming a possible explanation to the problem and trying to prove (or, in some contexts, disprove) the assumption
- Lateral thinking: approaching solutions indirectly and creatively
- Means-ends analysis: choosing an action at each step to move closer to the goal
- Method of focal objects: synthesizing seemingly non-matching characteristics of different objects into something new
- Morphological analysis: assessing the output and interactions of an entire system
- Proof: try to prove that the problem cannot be solved. The point where the proof fails will be the starting point for solving it
- Reduction: transforming the problem into another problem for which solutions exist
- Research: employing existing ideas or adapting existing solutions to similar problems
- Root cause analysis: identifying the cause of a problem
- Trial-and-error: testing possible solutions until the right one is found
Multiple forms of representation
Concrete models
Base ten blocks
Base Ten Blocks are a great way for students to learn about place value in a spatial way. The units represent ones, rods represent tens, flats represent hundreds, and the cube represents thousands. Their relationship in size makes them a valuable part of the exploration in number concepts. Students are able to physically represent place value in the operations of addition, subtraction, multiplication, and division.
Pattern blocks

Pattern blocks consist of various wooden shapes (green triangles, red trapezoids, yellow hexagons, orange squares, tan (long) rhombi, and blue (wide) rhombi) that are sized in such a way that students will be able to see relationships among shapes. For example, three green triangles make a red trapezoid; two red trapezoids make up a yellow hexagon; a blue rhombus is made up of two green triangles; three blue rhombi make a yellow hexagon, etc. Playing with the shapes in these ways help children develop a spatial understanding of how shapes are composed and decomposed, an essential understanding in early geometry.
Pattern blocks are also used by teachers as a means for students to identify, extend, and create patterns. A teacher may ask students to identify the following pattern (by either color or shape): hexagon, triangle, triangle, hexagon, triangle, triangle, hexagon. Students can then discuss “what comes next” and continue the pattern by physically moving pattern blocks to extend it. It is important for young children to create patterns using concrete materials like the pattern blocks.
Pattern blocks can also serve to provide students with an understanding of fractions. Because pattern blocks are sized to fit to each other (for instance, six triangles make up a hexagon), they provide a concrete experiences with halves, thirds, and sixths.
Adults tend to use pattern blocks to create geometric works of art such as mosaics. There are over 100 different pictures that can be made from pattern blocks. These include cars, trains, boats, rockets, flowers, animals, insects, birds, people, household objects, etc. The advantage of pattern block art is that it can be changed around, added, or turned into something else. All six of the shapes (green triangles, blue (thick) rhombi, red trapezoids, yellow hexagons, orange squares, and tan (thin) rhombi) are applied to make mosaics.
Unifix® Cubes

Unifix® Cubes are interlocking cubes that are just under 2 centimeters on each side. The cubes connect with each other from one side. Once connected, Unifix® Cubes can be turned to form a vertical Unifix® "tower," or horizontally to form a Unifix® "train".
Other interlocking cubes are also available in 1 centimeter size and also in one inch size to facilitate measurement activities.
Like pattern blocks, interlocking cubes can also be used for teaching patterns. Students use the cubes to make long trains of patterns. Like the pattern blocks, the interlocking cubes provide a concrete experience for students to identify, extend, and create patterns. The difference is that a student can also physically decompose a pattern by the unit. For example, if a student made a pattern train that followed this sequence, Red, blue, blue, blue, red, blue, blue, blue, red, blue, blue, blue, red, blue, blue.. the child could then be asked to identify the unit that is repeating (red, blue, blue, blue) and take apart the pattern by each unit.
Also, one can learn addition, subtraction, multiplication and division, guesstimation, measuring and graphing, perimeter, area and volume.
Tiles
Tiles are one inch-by-one inch colored squares (red, green, yellow, blue).
Tiles can be used much the same way as interlocking cubes. The difference is that tiles cannot be locked together. They remain as separate pieces, which in many teaching scenarios, may be more ideal.
These three types of mathematical manipulatives can be used to teach the same concepts. It is critical that students learn math concepts using a variety of tools. For example, as students learn to make patterns, they should be able to create patterns using all three of these tools. Seeing the same concept represented in multiple ways as well as using a variety of concrete models will expand students’ understandings.
Number lines
To teach integer addition and subtraction, a number line is often used. A typical positive/negative number line spans from −20 to 20. For a problem such as “−15 + 17”, students are told to “find −15 and count 17 spaces to the right”.
Cuisenaire rods

Cuisenaire rods are mathematics learning aids for students that provide an interactive, hands-on way to explore mathematics and learn mathematical concepts, such as the four basic arithmetical operations, working with fractions and finding divisors. In the early 1950s, Caleb Gattegno popularised this set of coloured number rods created by the Belgian primary school teacher Georges Cuisenaire (1891–1975), who called the rods réglettes.
According to Gattegno, "Georges Cuisenaire showed in the early 1950s that students who had been taught traditionally, and were rated 'weak', took huge strides when they shifted to using the material. They became 'very good' at traditional arithmetic when they were allowed to manipulate the rods."
- Use in mathematics teaching
The rods are used in teaching a variety of mathematical ideas, and with a wide age range of learners. Topics they are used for include:
- Counting, sequences, patterns and algebraic reasoning
- Addition and subtraction (additive reasoning)
- Multiplication and division (multiplicative reasoning)
- Fractions, ratio and proportion
- Modular arithmetic leading to group theory
Pictures
Pictogram

Pictograms are charts in which icons represent numbers to make it more interesting and easier to understand. A key is often included to indicate what each icon represents. All icons must be of the same size, but a fraction of an icon can be used to show the respective fraction of that amount.
For example, the following table:
| Day | Letters sent |
|---|---|
| Monday | 10 |
| Tuesday | 17 |
| Wednesday | 29 |
| Thursday | 41 |
| Friday | 18 |
can be graphed as follows:
| Day | Letters sent |
|---|---|
| Monday | |
| Tuesday | |
| Wednesday | |
| Thursday | |
| Friday |
Key: ![]() = 10 letters
= 10 letters
As the values are rounded to the nearest 5 letters, the second icon on Tuesday is the left half of the original.
Tally marks
.jpg)
Tally marks, also called hash marks, are a unary numeral system. They are a form of numeral used for counting. They are most useful in counting or tallying ongoing results, such as the score in a game or sport, as no intermediate results need to be erased or discarded.
However, because of the length of large numbers, tallies are not commonly used for static text. Notched sticks, known as tally sticks, were also historically used for this purpose.
- Clustering
Tally marks are typically clustered in groups of five for legibility. The cluster size 5 has the advantages of (a) easy conversion into decimal for higher arithmetic operations and (b) avoiding error, as humans can far more easily correctly identify a cluster of 5 than one of 10.

Tally marks high in most of Europe, Zimbabwe and Southern Africa, Australia, New Zealand and North America.
In some variants, the diagonal/horizontal slash is used on its own when five or more units are added at once.
Cultures using Chinese characters tally by forming the character 正, which consists of five strokes.

Tally marks used in France, their former colonies, Argentina and Brazil. 1 to 5 and so on. These are most commonly used for registering scores in card games, like Truco
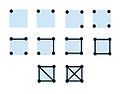
In the dot and line (or dot-dash) tally, dots represent counts from 1 to 4, lines 5 to 8, and diagonal lines 9 and 10. This method is commonly used in forestry and related fields.

Diagrams
A diagram is a symbolic representation of information using visualization techniques. Diagrams have been used since prehistoric times on walls of caves, but became more prevalent during the Enlightenment. Sometimes, the technique uses a three-dimensional visualization which is then projected onto a two-dimensional surface. The word graph is sometimes used as a synonym for diagram.
Gallery of diagram types
There are at least the following types of diagrams:
- Logical or conceptual diagrams, which take a collection of items and relationships between them, and express them by giving each item a 2D position, while the relationships are expressed as connections between the items or overlaps between the items, for example:
|


- Quantitative diagrams, which display a relationship between two variables that take either discrete or a continuous range of values; for example:
|


- Schematics and other types of diagrams, for example:
|


Table

A table is an arrangement of information or data, typically in rows and columns, or possibly in a more complex structure. Tables are widely used in communication, research, and data analysis. Tables appear in print media, handwritten notes, computer software, architectural ornamentation, traffic signs, and many other places. The precise conventions and terminology for describing tables vary depending on the context. Further, tables differ significantly in variety, structure, flexibility, notation, representation and use. Information or data conveyed in table form is said to be in tabular format (adjective). In books and technical articles, tables are typically presented apart from the main text in numbered and captioned floating blocks.
Basic description
A table consists of an ordered arrangement of rows and columns. This is a simplified description of the most basic kind of table. Certain considerations follow from this simplified description:
- the term row has several common synonyms (e.g., record, k-tuple, n-tuple, vector);
- the term column has several common synonyms (e.g., field, parameter, property, attribute, stanchion);
- a column is usually identified by a name;
- a column name can consist of a word, phrase or a numerical index;
- the intersection of a row and a column is called a cell.
The elements of a table may be grouped, segmented, or arranged in many different ways, and even nested recursively. Additionally, a table may include metadata, annotations, a header, a footer or other ancillary features.
- Simple table
The following illustrates a simple table with three columns and nine rows. The first row is not counted, because it is only used to display the column names. This is called a "header row".
| First name | Last name | Age |
|---|---|---|
| Tinu | Elejogun | 14 |
| Javier | Zapata | 28 |
| Lily | McGarrett | 18 |
| Olatunkbo | Chijiaku | 22 |
| Adrienne | Anthoula | 22 |
| Axelia | Athanasios | 22 |
| Jon-Kabat | Zinn | 22 |
| Thabang | Mosoa | 15 |
| Kgaogelo | Mosoa | 11 |
- Multi-dimensional table

The concept of dimension is also a part of basic terminology. Any "simple" table can be represented as a "multi-dimensional" table by normalizing the data values into ordered hierarchies. A common example of such a table is a multiplication table.
| × | 1 | 2 | 3 |
|---|---|---|---|
| 1 | 1 | 2 | 3 |
| 2 | 2 | 4 | 6 |
| 3 | 3 | 6 | 9 |
In multi-dimensional tables, each cell in the body of the table (and the value of that cell) relates to the values at the beginnings of the column (i.e. the header), the row, and other structures in more complex tables. This is an injective relation: each combination of the values of the headers row (row 0, for lack of a better term) and the headers column (column 0 for lack of a better term) is related to a unique cell in the table:
- Column 1 and row 1 will only correspond to cell (1,1);
- Column 1 and row 2 will only correspond to cell (2,1) etc.
The first column often presents information dimension description by which the rest of the table is navigated. This column is called "stub column". Tables may contain three or multiple dimensions and can be classified by the number of dimensions. Multi-dimensional tables may have super-rows - rows that describe additional dimensions for the rows that are presented below that row and are usually grouped in a tree-like structure. This structure is typically visually presented with an appropriate number of white spaces in front of each stub's label.
In literature tables often present numerical values, cumulative statistics, categorical values, and at times parallel descriptions in form of text. They can condense large amount of information to a limited space and therefore they are popular in scientific literature in many fields of study.
Licensing
Content obtained and/or adapted from:
- Mathematical logic, Wikipedia under a CC BY-SA license
- Problem solving, Wikipedia under a CC BY-SA license
- Manipulative (mathematics education), Wikipedia under a CC BY-Sa license
- Cuisenaire rods, Wikipedia under a CC BY-SA license
- Pictogram, Wikipedia under a CC BY-SA license
- Tally marks, Wikipedia under a CC BY-SA license
- Diagram, Wikipedia under a CC BY-SA license
- Table (information), Wikipedia under a CC BY-SA license