Venn Diagrams

A Venn diagram is a widely used diagram style that shows the logical relation between sets, popularized by John Venn in the 1880s. The diagrams are used to teach elementary set theory, and to illustrate simple set relationships in probability, logic, statistics, linguistics and computer science. A Venn diagram uses simple closed curves drawn on a plane to represent sets. Very often, these curves are circles or ellipses.
Similar ideas had been proposed before Venn. Christian Weise in 1712 (Nucleus Logicoe Wiesianoe) and Leonhard Euler (Letters to a German Princess) in 1768, for instance, came up with similar ideas. The idea was popularised by Venn in Symbolic Logic, Chapter V "Diagrammatic Representation", 1881.
Contents
Details
A Venn diagram may also be called a primary diagram, set diagram or logic diagram. It is a diagram that shows all possible logical relations between a finite collection of different sets. These diagrams depict elements as points in the plane, and sets as regions inside closed curves. A Venn diagram consists of multiple overlapping closed curves, usually circles, each representing a set. The points inside a curve labelled S represent elements of the set S, while points outside the boundary represent elements not in the set S. This lends itself to intuitive visualizations; for example, the set of all elements that are members of both sets S and T, denoted S ∩ T and read "the intersection of S and T", is represented visually by the area of overlap of the regions S and T.
In Venn diagrams, the curves are overlapped in every possible way, showing all possible relations between the sets. They are thus a special case of Euler diagrams, which do not necessarily show all relations. Venn diagrams were conceived around 1880 by John Venn. They are used to teach elementary set theory, as well as illustrate simple set relationships in probability, logic, statistics, linguistics, and computer science.
A Venn diagram in which the area of each shape is proportional to the number of elements it contains is called an area-proportional (or scaled) Venn diagram.
Venn diagrams are used heavily in the logic of class branch of reasoning.
Example

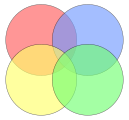
This example involves two sets, A and B, represented here as coloured circles. The orange circle, set A, represents all types of living creatures that are two-legged. The blue circle, set B, represents the living creatures that can fly. Each separate type of creature can be imagined as a point somewhere in the diagram. Living creatures that can fly and have two legs—for example, parrots—are then in both sets, so they correspond to points in the region where the blue and orange circles overlap. This overlapping region would only contain those elements (in this example, creatures) that are members of both set A (two-legged creatures) and set B (flying creatures).
Humans and penguins are bipedal, and so are in the orange circle, but since they cannot fly, they appear in the left part of the orange circle, where it does not overlap with the blue circle. Mosquitoes can fly, but have six, not two, legs, so the point for mosquitoes is in the part of the blue circle that does not overlap with the orange one. Creatures that are not two-legged and cannot fly (for example, whales and spiders) would all be represented by points outside both circles.
The combined region of sets A and B is called the union of A and B, denoted by A ∪ B. The union in this case contains all living creatures that either are two-legged or can fly (or both).
The region included in both A and B, where the two sets overlap, is called the intersection of A and B, denoted by A ∩ B. In this example, the intersection of the two sets is not empty, because there are points that represent creatures that are in both the orange and blue circles.
Overview

Intersection of two sets

Union of two sets

Symmetric difference of two sets

Relative complement of A (left) in B (right)

Absolute complement of A in U


A Venn diagram is constructed with a collection of simple closed curves drawn in a plane. According to Lewis, the "principle of these diagrams is that classes [or sets] be represented by regions in such relation to one another that all the possible logical relations of these classes can be indicated in the same diagram. That is, the diagram initially leaves room for any possible relation of the classes, and the actual or given relation, can then be specified by indicating that some particular region is null or is not-null".
Venn diagrams normally comprise overlapping circles. The interior of the circle symbolically represents the elements of the set, while the exterior represents elements that are not members of the set. For instance, in a two-set Venn diagram, one circle may represent the group of all wooden objects, while the other circle may represent the set of all tables. The overlapping region, or intersection, would then represent the set of all wooden tables. Shapes other than circles can be employed as shown below by Venn's own higher set diagrams. Venn diagrams do not generally contain information on the relative or absolute sizes (cardinality) of sets. That is, they are schematic diagrams generally not drawn to scale.
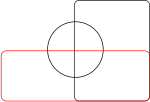
Venn diagrams are similar to Euler diagrams. However, a Venn diagram for n component sets must contain all 2n hypothetically possible zones, that correspond to some combination of inclusion or exclusion in each of the component sets. Euler diagrams contain only the actually possible zones in a given context. In Venn diagrams, a shaded zone may represent an empty zone, whereas in an Euler diagram, the corresponding zone is missing from the diagram. For example, if one set represents dairy products and another cheeses, the Venn diagram contains a zone for cheeses that are not dairy products. Assuming that in the context cheese means some type of dairy product, the Euler diagram has the cheese zone entirely contained within the dairy-product zone—there is no zone for (non-existent) non-dairy cheese. This means that as the number of contours increases, Euler diagrams are typically less visually complex than the equivalent Venn diagram, particularly if the number of non-empty intersections is small.
The difference between Euler and Venn diagrams can be seen in the following example. Take the three sets:


The Euler and the Venn diagram of those sets are:

Euler diagram

Venn diagram


Extensions to higher numbers of sets
Venn diagrams typically represent two or three sets, but there are forms that allow for higher numbers. Shown below, four intersecting spheres form the highest order Venn diagram that has the symmetry of a simplex and can be visually represented. The 16 intersections correspond to the vertices of a tesseract (or the cells of a 16-cell, respectively).

|

|

|

|

|
For higher numbers of sets, some loss of symmetry in the diagrams is unavoidable. Venn was keen to find "symmetrical figures...elegant in themselves," that represented higher numbers of sets, and he devised an elegant four-set diagram using ellipses (see below). He also gave a construction for Venn diagrams for any number of sets, where each successive curve that delimits a set interleaves with previous curves, starting with the three-circle diagram.

Venn's construction for four sets

Venn's construction for five sets
Venn's construction for six sets
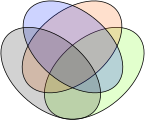
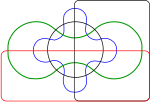
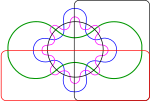
Venn's four-set diagram using ellipses
Non-example: This Euler diagram is not a Venn diagram for four sets as it has only 13 regions (excluding the outside); there is no region where only the yellow and blue, or only the red and green circles meet.

Five-set Venn diagram using congruent ellipses in a five-fold rotationally symmetrical arrangement devised by Branko Grünbaum. Labels have been simplified for greater readability; for example, A denotes A ∩ Bc ∩ Cc ∩ Dc ∩ Ec, while BCE denotes Ac ∩ B ∩ C ∩ Dc ∩ E.

Six-set Venn diagram made of only triangles (interactive version)


Edwards–Venn diagrams
Three sets

Four sets
Five sets
Six sets


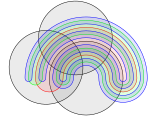
Anthony William Fairbank Edwards constructed a series of Venn diagrams for higher numbers of sets by segmenting the surface of a sphere, which became known as Edwards–Venn diagrams. For example, three sets can be easily represented by taking three hemispheres of the sphere at right angles (x = 0, y = 0 and z = 0). A fourth set can be added to the representation, by taking a curve similar to the seam on a tennis ball, which winds up and down around the equator, and so on. The resulting sets can then be projected back to a plane, to give cogwheel diagrams with increasing numbers of teeth—as shown here. These diagrams were devised while designing a stained-glass window in memory of Venn.
Other diagrams
Edwards–Venn diagrams are topologically equivalent to diagrams devised by Branko Grünbaum, which were based around intersecting polygons with increasing numbers of sides. They are also two-dimensional representations of hypercubes.
Henry John Stephen Smith devised similar n-set diagrams using sine curves[20] with the series of equations

Charles Lutwidge Dodgson (also known as Lewis Carroll) devised a five-set diagram known as Carroll's square. Joaquin and Boyles, on the other hand, proposed supplemental rules for the standard Venn diagram, in order to account for certain problem cases. For instance, regarding the issue of representing singular statements, they suggest to consider the Venn diagram circle as a representation of a set of things, and use first-order logic and set theory to treat categorical statements as statements about sets. Additionally, they propose to treat singular statements as statements about set membership. So, for example, to represent the statement "a is F" in this retooled Venn diagram, a small letter "a" may be placed inside the circle that represents the set F.
Related concepts

Venn diagrams correspond to truth tables for the propositions , , etc., in the sense that each region of Venn diagram corresponds to one row of the truth table. This type is also known as Johnston diagram. Another way of representing sets is with John F. Randolph's R-diagrams.


Resources
- Venn Diagrams and Cardinality, Book Chapter
- Guided Notes
Licensing
Content obtained and/or adapted from:
- Venn diagram, Wikipedia under a CC BY-SA license