Weighted moving average graphs continued
Contents
Calculating the Mean
The mean, or more precisely the arithmetic mean, is simply the arithmetic average of a group of numbers (or data set) and is shown using -bar symbol Failed to parse (MathML with SVG or PNG fallback (recommended for modern browsers and accessibility tools): Invalid response ("Math extension cannot connect to Restbase.") from server "https://wikimedia.org/api/rest_v1/":): {\displaystyle \bar {}} . So the mean of the variable is Failed to parse (MathML with SVG or PNG fallback (recommended for modern browsers and accessibility tools): Invalid response ("Math extension cannot connect to Restbase.") from server "https://wikimedia.org/api/rest_v1/":): {\displaystyle \bar{x}} , pronounced "x-bar". It is calculated by adding up all of the values in a data set and dividing by the number of values in that data set :Failed to parse (MathML with SVG or PNG fallback (recommended for modern browsers and accessibility tools): Invalid response ("Math extension cannot connect to Restbase.") from server "https://wikimedia.org/api/rest_v1/":): {\displaystyle \bar x={\sum_{}x\over n}} .For example, take the following set of data: {1,2,3,4,5}. The mean of this data would be:

- Failed to parse (MathML with SVG or PNG fallback (recommended for modern browsers and accessibility tools): Invalid response ("Math extension cannot connect to Restbase.") from server "https://wikimedia.org/api/rest_v1/":): {\displaystyle \bar x={\sum_{}x\over n}={1+2+3+4+5 \over 5}={15 \over 5}=3}
Here is a more complicated data set: {10,14,86,2,68,99,1}. The mean would be calculated like this:
- Failed to parse (MathML with SVG or PNG fallback (recommended for modern browsers and accessibility tools): Invalid response ("Math extension cannot connect to Restbase.") from server "https://wikimedia.org/api/rest_v1/":): {\displaystyle \bar x={\sum_{}x\over n}={10+14+86+2+68+99+1 \over 7}={280 \over 7}=40}
Spreadsheets
What is a Spreadsheet

A spreadsheet is a group of values and other data organized into rows and columns similar to the ruled paper worksheets traditionally used by bookkeepers and accountants. The spreadsheet software is mandatory to create computerized spreadsheets. Microsoft Excel is a form of a spreadsheet. Spreadsheets can support keeping track of data, support in quickly formulating subtotals, populating visual graphs and charts and essentially is a working tool that can easily be shared. A worksheet is the single spreadsheet document. A workbook allows multiple worksheets to be saved together in a single spreadsheet file. Worksheets are divided into rows and columns. The intersection of a row is called a cell. One must enter content into the active cell, or current cell; it has a border around it to make it be easily identified. Data is entered directly into worksheet cells by clicking a cell to make it the active cell. Labels, constant values, formulas, and functions are the data that is entered into a cell. Before one enters a formula or function into a cell, one must begin with some type of mathematical symbol, usually the equal sign (=). Spreadsheets are used to organize and calculate data. There is a maximum number of rows and columns in a spreadsheet which varies depending on the version of software you have. It is essential to know how to use spreadsheets for school, work, sports, or anything that requires data!
Tables, Graphics, and Templates

Tables, graphics, and templates are all available to a user with application software, such as Microsoft Word, Microsoft Excel, and PowerPoint. Tables are ways a user can organize data and information at their convenience. According to Microsoft Word, there are now many different available options for users who are looking for various kinds of tables. These different options include the following: the Graphic Grid, Insert Table, Draw Table, insert a new or existing Excel Spreadsheet table, and Quick Tables. The concept of using tables for data input is relatively simple. In order for a user to insert a table, the user must first open Microsoft Word. Once they have done this, they must click the "table" button to customize the table to achieve their needs. The overall format for a table consists of a large (or small) grid that can be altered by the amount of information the user has, ex. four columns five rows. Next, the user must insert the table into the word document by selecting "insert table" from the dropdown menu. Microsoft Excel contains pivot tables that are tables that include data from a spreadsheet with columns and rows that can be specifically selected. Graphics in Microsoft Word are pictures, or clip art that are able to be inserted into a Microsoft Word document, Excel Spreadsheet, PowerPoint slide, or any other Office application. the most common graphic used in Excel is graphs. You can create graphs based on data taken from your spreadsheet. Graphics are inserted into these Office Applications to enhance the information presented in a Word Document, Excel worksheet, or PowerPoint slide. A user can insert their own picture through their office documents; add clip art, shapes, SmartArt, screenshot, or Word Art. Templates are pre-constructed document layouts whose primary use is to assist a user in creating a specific type of document in a convenient amount of time. The different options of templates vary, but a few of the following are common ones used every day: agendas, brochures, calendars, flyers, fax covers, and many more. Templates are used to save a user time, and confusion in creating their document.
How to use a Spreadsheet
When using a spreadsheet application, the user can use various concepts to compute the data entered into the cells in the spreadsheet. These different concepts are provided within the program. Some very common concepts that are utilized are charts, functions, formulas, and cell referencing.
Charts
A chart can be created as its own object or embedded within the sheet itself. This is helpful when a user needs to analyze data or represent changing data. Some form of charts are: lines graphs, scatter plot charts, bar charts, Venn diagram charts, and the list goes on.
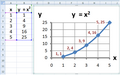
A chart generated using Excel.

Functions
A function is a pre-programmed mathematical formula to allow the user to make calculations based on the data input. The functions under spreadsheets are there to perform a simple calculation by using a certain value, called arguments. If the user wishes to create his own formula, Visual Basic can be used to write a formula and then the spreadsheet program can input the values into the newly written formula, reporting the data back into the sheet.There are many different reasons to have functions on spreadsheets. One would be for arithmetic functions to process numerical data. The next would be statistical functions that use analysis tools and averaging tools. This would be useful for finding the average of the numbers in a certain row/column on a spreadsheet. The next function is date that processes and converts dates. This function could be used to put the sequential dates in order on the spreadsheet. The next function is logic functions that process logic data. An example of logic data would be an AND/OR function. If there was something that needed to be marked yes if it is above 5 and marked no if it is below 5 then that would be a logic function. The last one is financial functions that process monetary data. They all must start with an equal sign, the name of the function, parenthesis opening and closing. In the function a comma or semicolon is used as the delimiter, depending on what settings are there in the spreadsheet would depend on which one to use. An example would be =SUM(A1:A4), this function would find the sum in those cells. Some of the most common functions are SUM, AVERAGE, IF, COUNT, MAX and MIN.
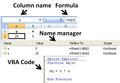
A function being edited using VB in Excel.

Formulas
A formula identifies the calculation needed to place the result in the cell it is contained within. This means a cell has two display components; the formula itself and the resulting value. Typically, a formula consists of five expressions: value, references, arithmetic operations, relation operations, and functions. By using these expressions, formulas can help to make tables, solve math problems, calculate a mortgage, figure out accounting tasks, and many other business-related tasks that use to be done tediously on paper.
A formula always starts with an equals sign (=), followed by a constant, a function or a reference, then followed by an operator, and then followed by another constant, function or reference. A constant is a value that never changes; this includes numbers, dates, titles and other text input. References represent a certain cell, such as “A2”. An operator is usually a math symbol, such as “+” or “*” which tells the computer how to compute (add or multiply, respectively) the given constants or functions given in the formula. It is good to be careful that one knows the difference between a constant and a reference. If the constant “30” is input into cell A3, and the formula says “=30+2”, then if A3’s value changes, the expression of the formula will not change unless the formula itself changes. If one wishes to have a formula that returns the value of a cell, then the formula should read “=A3+2”. Another thing to note is that the operators will follow the basic “rules” of calculation. For example, the formula “=3+2*4” will add 3 to product of 2 and 4, rather than add 3 and 2, then multiply the sum times 4. (Parenthesis can be used to change the order: (3+2)*4 would add first, then multiply.) Operators are not always arithmetic, they can also be comparison, text concatenation, and reference operators. Comparison includes greater than, lesser than, greater than or equal to, and lesser than or equal to. To connect two values into one value, a text concatenation (the “and” sign i.e. “&”) is used. The signs used as reference operators are the following: a colon is used to reference two cells and all the cells between them (i.e. B1:B10); a comma is used to combine multiple references into one reference (i.e. B1:B10,C1:C10); and a space is used as an intersection operator.

Using a formula in Excel.

Spreadsheet Graphics


Cell Referencing
Cell referencing refers to the ability to utilize a cell or range of cells in a spreadsheet and is commonly used to create formulas to calculate data. Formulas can retrieve data from one cell in the worksheet, different areas of the worksheet, or different cells throughout an entire workbook. There are two ways of doing this: relative and absolute cell referencing. A relative cell reference will adjust as the formula is copied from another cell while an absolute will not adjust. An example of this would be "=D2+F2" which is row 2 to row 3 which will equal "D3+F3". It is also important to note that a user can reference both the same sheet and other sheets in a book using this concept.
Pivot Tables
One the most powerful features available in the Microsoft Office spreadsheet program Excel, is pivot tables. Pivot tables allow you to manipulate large amounts of raw data. It makes it easy to analyze the data in different ways, with a simple click and drag. Vast quantities of data can be summarized in a variety of ways. Calculations can be performed by row or column. Data can be filtered or sorted automatically by any or all of the fields. Excel can even recommend a basic layout of a pivot table based on the type of data selected. A wizard is available to assist in the creation of the table. An important thing to remember when using pivot tables, is that any time the original data source is modified, the data must be refreshed in the pivot.

Once the pivot table has been created and the data has been analyzed in a meaningful way, it can then be represented graphically using pivot charts. All the basic chart types available in Excel are available in the pivot chart menu. Much like the pivot tables they are built on, they can also be manipulated with ease. They can be filtered to display only the relevant information form the main data source. They can also be added to and refreshed very easily.
Licensing
Content obtained and/or adapted from:
- Mean, Wikibooks under a CC BY-SA license
- Application Software, Wikibooks under a CC BY-SA license