COVID-19 Models
The Biomathematics Research Group (BRG) is directed by Juan B. Gutiérrez. The BRG develops COVID-19 projections for every county in the US.
Coronavirus disease 2019 (COVID-19) is a novel human respiratory disease caused by the SARS-CoV-2 virus. The first cases of COVID-19 disease surfaced during late December 2019 in Wuhan city, the capital of Hubei province in China; this particular virus and is often referred to as the wild type (as opposed to variants that appeared later in the pandemic with mutations in their genome with respect to the wild type). Shortly after, the virus spread to several countries [42]. On January 30, 2020, The World Health organization (WHO) declared the virus as a public health emergency of international concern (PHEIC), WHO’s highest level of alarm [86]. There were 171 COVID-19 deaths worldwide that day. Forty one days later, on March 11, 2020, when the global death toll stood at 4,616, it was officially declared to be a global pandemic [87].
The genesis of this project took place in the City of San Antonio, Texas, the seventh largest city in the US, with a population of 1.5 million people as of 2021. It is the most visited city in Texas, and the 17th most visited city in the nation, attracting 37 million visitors in 2019 [10]. Given the high density of visitors year-round, the city has the potential to become an epicenter of transmission during a pandemic. The City of San Antonio entered a partnership with Bexar County to create the San Antonio Metro Health District (SAMHD); this entity is in charge of collecting case data for infectious diseases. San Antonio is part of the South Texas Regional Advisory Council (STRAC) designated by the Texas Department of State Health Services (DSHS) to develop, implement and maintain the regional trauma and emergency healthcare system for the 22 counties with a mixture of urban, suburban, rural and frontier areas, encompassing over 26,000 square miles in southwest Texas. STRAC is one of twenty-two regional advisory councils in Texas that comprise the Texas Trauma / Emergency Healthcare system; this entity keeps real-time records of patients in all hospitals in the region.
Modeling efforts by the BRG early in the pandemic resulted in a request for help from the City of San Antonio. The BRG published on March 18th, 2020, a pre-print with the model behind the best and worst-case scenario projections for every county in the US; these projections did not consider government interventions, thus the time line is accelerated although the total number of detected cases is correct for the wild type. These estimations included totals by county, by state and for the entire US. This resulted in considerable national and international media attention. By March 20th, 2020, the BRG was approached by STRAC and SAMHD to assist in forecasting the COVID-19 pandemic in the city of San Antonio. On March 31st, in a presentation by the BRG to the Mayor of San Antonio and the CEOs of the hospitals in the metropolitan area, the projections of the total number of cases expected with the wild type were: 34M cases in the US, 2.6M cases in Texas, and 170K cases in San Antonio. The actual number of wild type cases in the US 16 months later, by July 15th, 2021, were: 34M cases in the US, 3M cases in Texas, 230K cases in San Antonio. These estimates proved to be remarkably accurate given the state of information available at the moment.
In the beginning of the pandemic, as data started poring in, estimates we based on “current conditions“, which were variable. Hence, until there was enough data to make accurate estimates, forecasting had great variability. During the early phase of an epidemic, there is the tendency among modeling groups to not publish results. The BRG took a different approach by making all stages of modeling available in Twitter under the hashtag #ModelingInTheOpen. These models were reported to the City of San Antonio, and remain public documents.
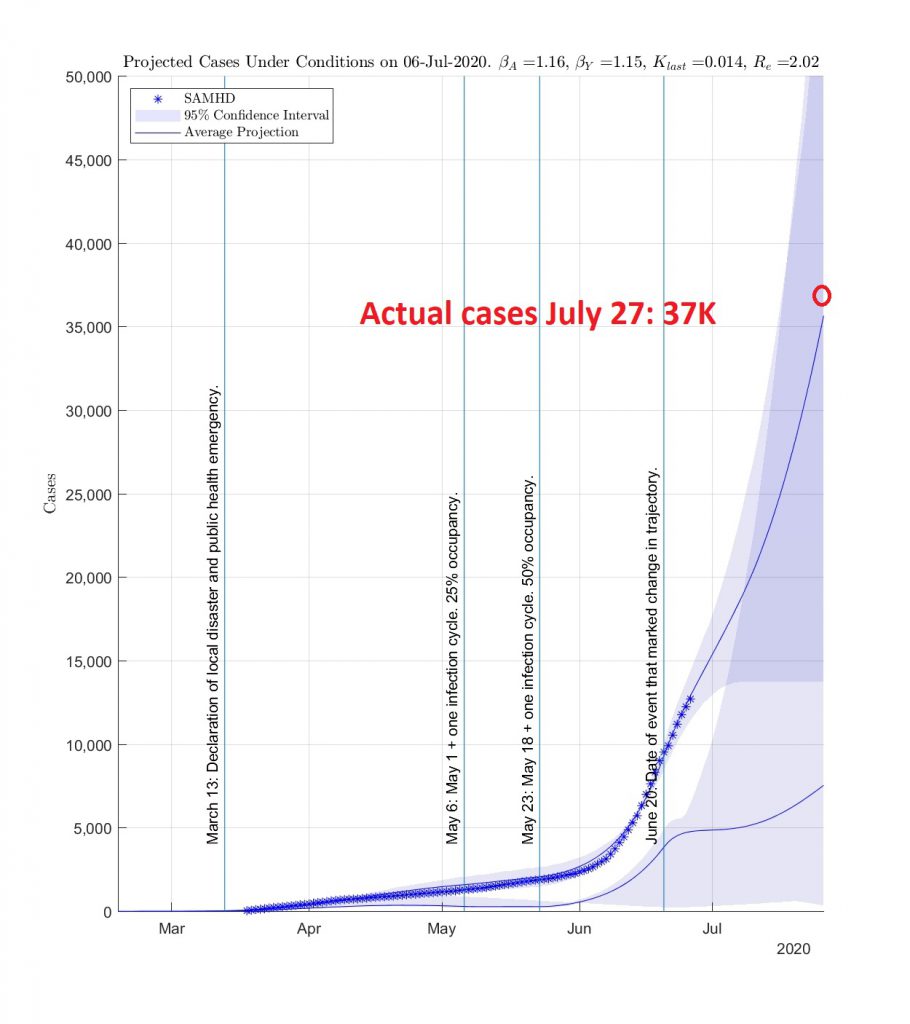
By July 6th, 2020, the BRG had enough data to start making accurate projections. At that point, we were able to anticipate the large summer surge even when there was skepticism about the extent of the outbreak. The figure below shows data vs. projections, San Antonio, TX, July 6, 2020. In this report, presented to the City of San Antonio on July 6th, 2020, when the case count was 15K, the model was able to predict a 246% increase in cases three weeks in advance. Note that: (i) for the purpose of forecasting, two weeks of SAMHD data had to be removed to account for adjustment in daily cases due to case tracing, and (ii) the proposed model was able to predict correctly the change in concavity of the cumulative curve that occurred by the first week in July.
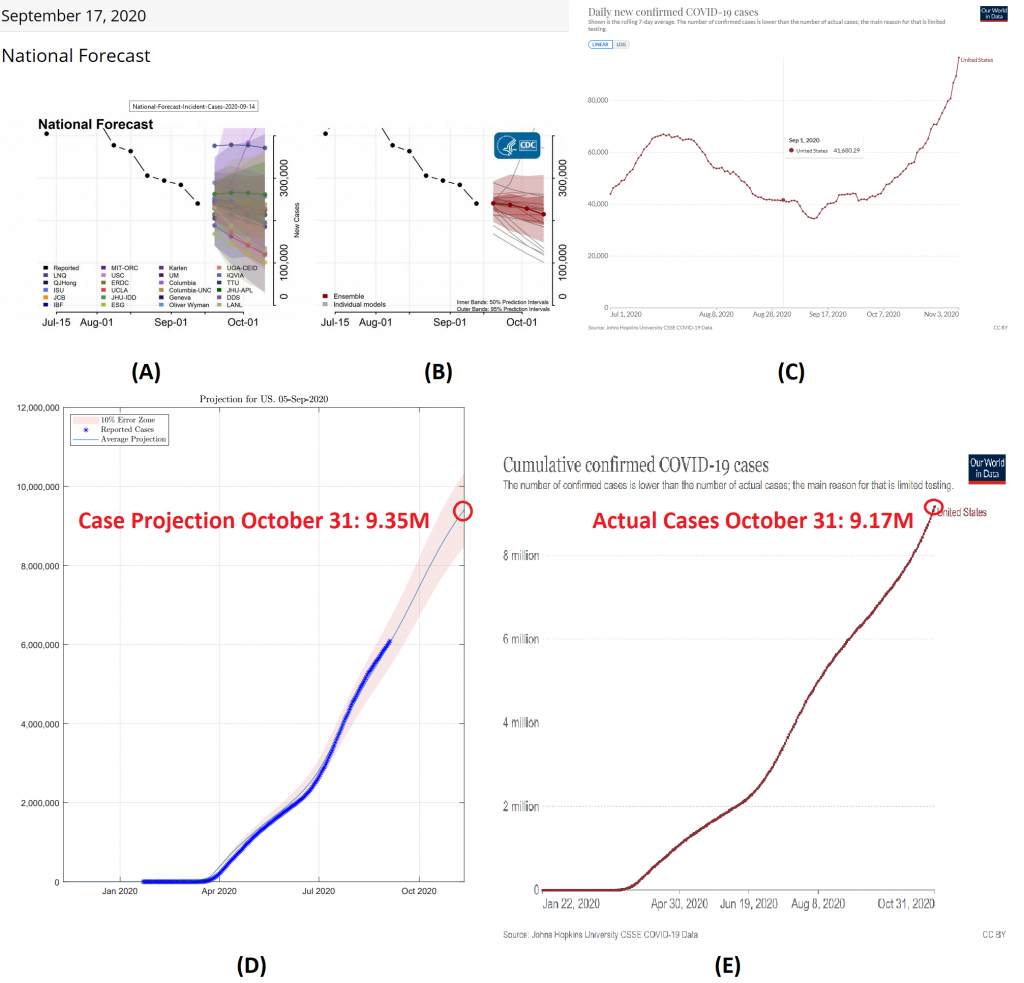
The figure below shows a comparison of other models vs. the BRG model during a pivotal point in 2020. By early September, 2020, nearly all models were projecting a decrease int he number of cases. The BRG Model predicted accurately the fall surge. The BRG’s model showed remarkable agreement with the actual data.
The following is a tweet from July 23, making a projection for the period July-December, 2020. On 7/20, San Antonio had 233,167 total cases and 3,586 deaths. The projection I made on July 23 was 50K-200K new cases and between 750-3,500 deaths by December, 2021. As of 9/13, we had accumulated 300,263 total cases and 4,145 deaths. That is, 67K new cases and 559 new deaths since July 20. The range of the estimate, sadly, will be correct, probably toward the high-end. This, of course, could be derailed by a new variant.
Projections… here is what we thought on Feb/2020 , vs today:
— Juan B. Gutiérrez, Ph.D. (@biomathematicus) July 23, 2021
Projected:
US: 34M cases
Texas: 2.6M
San Antonio: 170K
Actual:
US: 34M cases
Texas: 3M
San Antonio: 233K
The error increases as we decrease geographic size. Posted in 2020 at: https://t.co/lK11sYV0AZ
(1/4) pic.twitter.com/OomxrwBoSJ
In summary, the BRG developed a sophisticated analysis pipeline for forecasting COVID-19. It proved to be remarkably accurate. We continue making improvements and researching foundational aspects of epidemiological modeling. These advances promise to improve forecasting in may infectious diseases.
This is a project of the Biomathematics Research Group